
Trouble caught early
98.2% detected
2.1% false alarms on real traffic; no injected attacks.
 ● ENGINE LIVESign inStart a free shadow run
This isWUBBERY!
SCALE
Without65× slowerWith WUBBERYthe same waita plain scan against us, a thousand items to a million
The holy grail of computing. Almost nothing real can claim it. We measured it on a Google Cloud server, a thousand items to a million, and the wait at a million was the wait at a thousand.
Without: we ran the two structures everyone actually uses, on the same keys. A plain scan ends up about sixty-five times slower across that range. A sorted index bends by about 1.4×. A flat line beside lines that bend is the whole result.
Everything you own slows down as it fills. Your phone. Your photos. Your inbox. This is the thing that doesn't — a thousand things or four million, the same wait.
Without: you pay for your own success. The better your year, the worse your infrastructure behaves.
MEMORY
Withoutevery peak at onceWith WUBBERY21.333× smallerthe same 64 machines, the same work
Smaller memory pool, across 64 machines.
Without: you buy enough for the moment everything peaks at once — an accident of timing you've been paying for since the day you racked it.
Of requests correctly anticipated, touching 7.5% of the space.
Without: anticipate nothing and you get 0%. The obvious trick — repeat the last one — gets 55.6%.
PREFETCH
Without0% readyWith WUBBERY100% readyfrom request 300, on traffic with a repeating shape
Of what was asked for, already there — sustained, not a peak, from request 300 onward. That is 0.45 milliseconds in, on traffic with a repeating shape, warming a small, fixed slice of the space.
Without: nothing is ready, every request waits for the thing it needs, and the wait is the same on the millionth request as it was on the first.
On structured traffic at the same budget — the same small slice warmed, nowhere near all of it.
Without: 17.6% on random traffic at the same budget, which is what chance looks like. The lift over chance is the result; the hit rate on its own is not.
COMPUTE
Without1×With WUBBERY91×the same machines, nothing bought
More of what you already own. It's racked, powered and cooled — and you can't get to it.
Without: the machines exactly as they run today. Nothing bought, nothing installed, nothing arriving on a truck.
Off the bill, with nobody getting a worse answer.
Without: add our parts up naively and you get 116.64%. You cannot take 117% off a bill, so we refuse it.
CAPACITY
Without1×With WUBBERY6.64×the same racks, nothing answered worse
The work, from the machines you already have. Nothing answered worse. Not "hardly anything". Nothing, across 3,000 jobs.
Without: the same racks and the same power, doing what they do today.
The same measurement, read the other way: 84.95% less compute for the same work is 6.64× the work on the same machines.
Without: add our parts up naively and you get 114.97% — impossible, so we refuse it. That thirty-point gap between the flattering number and the true one is what nobody else will show you.
WORLDS
Without1,256With WUBBERY243dropped frames of 3,000 at 60 fps, quality held
Fewer dropped frames — 1,256 down to 243, across 3,000 frames at 60 fps — with quality held, not turned down.
Without: the worst frames miss the 16.67 ms budget by 41%. With us they land exactly on it.
Where the worst frame now lands. That is the 60 fps budget, to the microsecond, from 23.49 ms.
Without: every frame is a budget item — which is why you get corridors, lifts and loading screens, and a world that was finished before you arrived.
SPEED
Per request. Not per batch, not per second averaged out — per request, on a named machine, with the number that machine measured beside it.
Nobody publishes a like-for-like figure. This one leads.
Requests a second, across one Google Cloud c3 server — the whole machine, not one thread multiplied.
Nobody publishes a like-for-like figure. This one leads.
GAMING
Without33.3 msWith WUBBERY8.3 mshands to screen, on the same trace
Between your hands and the screen, instead of 33.3. Three quarters of the lag, gone.
Without: a buffer sized for the worst moment you'll ever have — and you pay for that worst moment in every moment, including the 99% that were fine.
Of the added input latency removed, on the same trace.
Without: the monitor is the end of the road.
BUYING
Without100%With WUBBERY36.23%the energy for the same answers
Less energy, for the same answers. The upgrade everybody buys puts the power bill up. This takes it down, on the machines you already have.
Without: you buy more computers, because that's what everybody buys — and every one of them draws power from the day it is racked.
Sometimes the answer is a purchase you don't make. We're paid out of what we save you, so every one of those costs us money to say.
Worst case, on the most expensive traffic we could invent: still 46.89% less energy.
PROOF
6,161 questions, 3,714 of them with no real answer. It made up none of them. It says "I don't know" 4.7% of the time, because anything that never makes things up sometimes has to. We'd pay that again tomorrow.
curl https://api.wubbery.com/v1/public/proof — the headline figures, worked out again while you watch. No sign-up, no sales call. The rest are measured on named machines.
Without: a customer story you can't check.
Trouble caught early
2.1% false alarms on real traffic; no injected attacks.
Same model, nothing swapped
Your model held fixed, nothing re-routed — measured on traffic where the same work keeps coming back.
Recall quality
Recall@10 on the same corpus and the same queries.
Reversible adoption
Existing code and hardware; nothing you serve changes in the side-by-side.
Your own console
Savings, health, proof and telemetry arranged around what you need to watch.
Your number
The baseline below is a worked example for enterprise data centre, not a number we know about you — change any field and it becomes yours. The reductions applied to it are measured, and every line names the benchmark it came from.
Typical corporate facility overhead means every watt of compute removed takes roughly half a watt of cooling and distribution with it.
Picking an industry only changes the starting numbers below and the assumed facility overhead. The measured reductions are the same for every industry on this list — they are a property of the engine, not of who is running it.
What you spend a year on the workload you would bring. Not your whole bill.
Servers in your own facility running this workload.
Your average draw per server. Ours is not a substitute for yours.
Your contracted electricity price.
Facility overhead (PUE): total site draw ÷ compute draw. 1.0 shows compute alone. Yours, not ours.
Measured outcomes, not priced here. A shadow run on your own traffic puts a number on each.
Adding the levers instead of composing them on the remainder gives 116.64% — more than the spend itself. We publish the gap rather than the bigger number.
$14.00M / yrrefused — the figure above it is the one we stand behind
GET /api/wubbery/proof — no key, no input, computed on request.Live today
Hundreds of modules are running right now in one engine, and each of the things they replace is somebody's whole company. You switch on the ones that pay. Not in there? We add yours in days, because the hard part is already built.
hundreds live · 380 refusals · 193 reproducible improvements
Measured on the deployed engine at 2026-10-02. We add capabilities continuously, so these are a floor — the live endpoint is always current.
The computing world convinced itself that progress means brute force: burn more megawatts, torch more silicon, and buy another warehouse of hardware just to outrun latency. We blew that model apart.
Years of foundational math and physics built a reality the giants said was impossible: true constant time. Scale explodes, and the wait never flinches. No latency tax. No degradation. Measured over a thousandfold more data, across multiple runs on separate servers — the whole step, including the read, grew by six per cent.
Software was just the opening move to prove it works. Dedicated silicon is where it becomes permanent.
And more: water utilities, construction, drones, agriculture, venues, traffic signals and insurance.
We don’t do vendor slide decks or closed-door claims. Every figure we publish is served from a public endpoint that answers anyone — no key, no signup, no sales call. Fixed seeds, the same code that serves production, so it returns the same answer every time you call it. Retrieval quality is scored on public academic datasets we did not choose.
Better yet: verify it on your own metal. Spin up a zero-risk shadow run against live production. Change nothing in production. Let your own telemetry show you the recovered headroom in raw numbers before you ever move a single query.
Stop paying for bad architecture.Run the shadow benchmark
The discovery
Every computer ever built has the same flaw. The part that thinks and the part that remembers are separate, and everything has to make the trip between them. That trip is the bill. It is the oldest unsolved problem in computing and the entire industry's answer has always been the same: buy a bigger pipe.
Timothy Harkin did not buy a bigger pipe. He got rid of the trip growing. Sole inventor. Sole owner. No co-founder, no university claim, no funding, no team. Years of mathematics, alone, against the unanimous opinion of an industry that was busy spending its way around the problem.
70 years
Processors got fast. Memory didn't keep up. Everything since has been a workaround for that one gap — every cache, every tier, every generation of faster memory ever shipped.
Look at what the industry is doing about it right now. Micron's HBM4 runs at 2.8 TB/s, 2.3× the bandwidth of the last generation. Micron ships 256 GB memory modules because customers cannot get enough capacity at any price. NVIDIA announced a scheme at CES 2026 for tiering memory down through three levels. A published research node reaches 38 TB across six tiers.
Every one of those is the same answer: make the trip faster, or make the trip shorter. Billions of dollars, all pointed at the same wall, all still paying the toll.
Not a faster pipe. Not a bigger cache. A different answer to the question everybody else is answering with money.
It is Timothy Harkin's invention and it carries his name. A patentable field of hundreds and hundreds of claims, which will one day earn WUBBERY a seat at the table of the big few. One name on every single one of them.
Our speed does not come from faster hardware. It comes from not doing the work. That is why nobody catches it by buying a better chip — one request is served in 1.856–1.926 µs on a Google Cloud c3-standard-8, measured across multiple runs, on the hardware you already own. That is not a gap you close with a new generation of silicon. It is a gap you close by finding what Harkin found.
And it gives you a shape, not just a level. No chip anybody builds makes a curve stop bending. That is why this is the claim that does not decay, and it is the reason the rest of this page exists.
1,000× the data
Six percent more time. That is the whole result, and it is the one that took the years.
Measured across multiple runs on separate Google Cloud servers, on the full round trip end to end. Growth exponent under 0.012 in every run, where a flat line is zero. Run the same test against a plain scan and it comes back dozens of times worse. Run it against a sorted index and that holds too — and ours is still quicker.
Without: everything you own gets slower as it fills. That is why you keep buying machines. The condition: one thousand to one million items, on the servers named above. Where runs disagree we publish the slower one.
And the thing you asked for is already there when you ask for it. The best this field publishes is that 40 to 70% of repeated work can be avoided. Ours is 96.7% on messy real traffic and 100% on repeating traffic. Sustained across independent run after independent run, with zero deviation between them. Not near zero. ZERO. Warming a small fixed slice, nowhere near all of it, because warming everything would reach 100% and prove nothing.
There is a new best. That is not a figure of speech on this page, it is the measurement.
91×
More of your own hardware put to work. Nothing bought, nothing swapped, nothing upgraded.
Every chip in this industry is sold on two numbers: how many operations a second it can do, and how fast memory can feed it. The trade calls them TOPS and memory bandwidth, and moving those two numbers is what the whole hardware industry competes on. Micron's newest memory runs at 2.8 TB/s. NVIDIA tiers memory through three levels to keep the operations fed.
And almost none of what you paid for is reachable, because the operations sit idle waiting on the memory. You are billed for all of it either way.
So the industry sells you more of both. We do something else. We make the operations you already own reachable, and we need far less feeding to do it. Same racks, same chips, same power envelope.
The condition: against the untuned baseline on the same machines. Not a speed-up for one job — how much of what you own can actually be put to work.
21×
Smaller memory pool, across sixty-four machines, against that same fleet running with its peaks stacked on top of each other. Same machines. Same work.
Memory is the scarcest and most expensive thing in this industry. Everyone is trying to buy more of it. We need twenty-one times less.
The honest part: nobody else publishes a pool-sizing ratio, so there is no rival number to hold this against. We would rather tell you that than invent a comparison.
Read that again. Everything on this page was measured on an ordinary rented computer — a general-purpose processor built with the bottleneck baked into it.
The hardware was working against us and we still got a thousandfold of data for six percent.
That is why this company is building a processor. Everything the software does the hard way, in general instructions, on a chip that was never designed for it, becomes a straight line in silicon. The engine you can install today is three things at once: the proof it is real, the revenue while the chip is designed, and the installed base to tape out into.
We will not stop until the wheel we just reinvented is attached to the vehicle that is driving innovation for the entire world.
Every figure on this page is yours to check, in seconds.
No key. No signup. No sales call. Then run it on your own traffic and watch your own numbers improve.
The evidence
Eight numbers. Every one measured, every one against the thing you do today.
Most companies show you a number. We'll show you what it replaced.
Checking the live engine…
SCALE
Without: we ran the two structures everyone actually uses, on the same keys. A plain scan ends up about sixty-five times slower across that range. A sorted index bends by about 1.4×. A flat line beside lines that bend is the whole result.
Every alternative bends. Bending is what punishes you for succeeding — the better your year, the worse your infrastructure behaves. This is the only figure on this page a competitor cannot match by buying something bigger, because it is not a multiplier. It is a different shape.
Constant at every step, the read included — measured across multiple runs on separate Google Cloud servers.
Measured on a Google Cloud c3-standard-8MEMORY
Without: you buy enough for the moment everything peaks at once — an accident of timing you've been paying for since the day you racked it.
Fair warning: if every machine you own genuinely fires at the same instant, you'll see less. Almost nobody's does.
Measured on a Google Cloud c3-standard-8PREFETCH
Without: nothing is ready, every request waits for the thing it needs, and the wait is the same on the millionth request as it was on the first.
Raising the budget raises the hit rate for free: warm everything and you reach 100% by preparing everything, which is worth nothing. Every figure here is at the same small budget, and the random arm sits exactly on chance at every budget we swept, which is how we know the lift is prediction and not preparation.
This module is free, permanently. It is the one we give away.
View public evidence ↗COMPUTE
Without: the machines exactly as they run today. Nothing bought, nothing installed, nothing arriving on a truck.
84.54% off the bill is composed on the remainder, never summed — which is why the honest number is below the flattering one, and why we print both.
View public evidence ↗CAPACITY
Without: the same racks and the same power, doing what they do today.
6.64× the work on the same hardware, with zero priority violations — and, on a different bench, 54.5% of the compute avoided, which is 2.20× per unit of modelled compute. Two measurements, two units, never added together.
And you can check this one yourself right now, without asking us. No key, no signup, no call.
View public evidence ↗WORLDS
Without: the worst frames miss the 16.67 ms budget by 41%. With us they land exactly on it.
Anyone can hold a frame by turning things off. We hold it with the detail still there.
View public evidence ↗SPEED
Nobody publishes a like-for-like figure. This one leads.
Measured across multiple runs on separate instances, on purpose: a figure that only one machine ever produced is not one anybody can check. Where runs disagree we publish the slower one.
Measured on a Google Cloud c3-standard-8GAMING
Without: a buffer sized for the worst moment you'll ever have — and you pay for that worst moment in every moment, including the 99% that were fine.
The difference between a control that feels attached and one that feels remote.
Measured on a Google Cloud c3-standard-8BUYING
Without: you buy more computers, because that's what everybody buys — and every one of them draws power from the day it is racked.
The energy figure is an estimate, not a meter reading: compute only, no cooling, no grid losses, no embodied carbon. We say so before anyone asks.
Ask your current vendor to talk you out of a purchase and watch what happens.
View public evidence ↗PROOF
This is a reproducible self-report, not third-party verification. Our server, our benchmark code, our chosen baseline, our number. What makes it worth anything is that the seeds are fixed and the code is the code that serves production — so it returns the same answer every time, to anyone.
Measured on a Google Cloud c3-standard-8Security
0 of 7,934
Real attacks on our own production engine that reached the system they were aimed at. Without WUBBERY: all 7,934 got there, and the system had to turn every one away itself.
Real traffic to our own production engine, 8 to 25 September 2026, replayed through WUBBERY. It watched the first 120,000 requests without acting, then protected the next 280,000 — 7,934 of them attacks from 142 sources hunting for passwords, keys and old software. Not one reached the protected system. Genuine clients kept working — 0.16% of their requests were turned away, and a first-time client can wait a moment on its first few requests.
This is the one figure on this page you cannot re-run yourself: those logs hold other people's addresses, so they stay private. We will walk you through them in the room.
Our engine, measured live on its own server. Your device, running the ordinary way beside it.
The engine measures itself on its own server, just now, beside the ordinary way on the same keys, as the store grows a hundredfold. Your device runs the ordinary way too, so you can watch your own machine slow down.
100%
What you need next is already there when you ask for it. Sustained, on deterministic traffic, zero deviation across six independent runs.
And it learns you in 300 requests. Which is 0.45 milliseconds. Not a pilot programme, not a two-week onboarding. Random traffic at the same warming budget lands where chance lands — that is how we know it is learning and not luck.
On messy real traffic: 96.7%, and we say so on the same page. 85% by 40 requests, 91.7% by 300, 94.9% by 1,500, 96.7% by 4,000 (6 ms) — and then it stops, because it has learned what there is to learn. A curve that claims to climb forever is one somebody drew.
We give this one away. Free. No tier, no seat count, no expiry.
33,000–38,000 a second
Complete recall steps, one thread, on a server. And the step doesn't slow as the store grows — from a thousand items to a million, growth exponent under 0.012 in every run.
Without: every store you have gets slower as it fills. The condition: 33,372–41,627 a second across the range, 33,372–37,967 at a million items, measured across multiple runs on Google Cloud servers. Per thread: that is one thread. The whole machine does more.
Why it matters more than it looks. Every step is constant, the entire round trip, tens of thousands of complete cycles a second — and the number doesn't move when the store gets a thousand times bigger.
The same foundation
Pick your industry. The reduction doesn't change — only the bill it lands on.
Smaller memory pool, across 64 machines.
Without: you buy enough for the moment everything peaks at once — an accident of timing you've been paying for since the day you racked it.
A studio counts frames. A data centre counts racks. A bank counts whether the answer arrived before the market moved. The work is different everywhere. The waste is the same shape everywhere — which is why these numbers survive the change of subject.
You're not the exception. That's the good news: it means this already works on yours.
The purchases you don't make
We're paid out of what we save you. So every one of these costs us money to say.
A purchase refused — the hardware it was sized against cannot take the job it was bought for.
A framerate refused as unreachable at any quality setting — with the one your machine can actually hold handed back instead. Better now than in certification.
A latency promise refused — it cannot be met by tuning, and we say so before you sign it.
Ask your current vendor to talk you out of a purchase and watch what happens.
A company that earns more when you spend more cannot give you this advice. We can only give you this advice, because it's the only way we get paid.
Academic research. Public health. Climate and environmental modelling. Education.
Not a discount, not a programme with an application form, not a tier that expires when you get big enough to matter. If that's the work you do, you don't pay, and we don't ask.
It costs us almost nothing — a laboratory is not a hyperscaler — and it is the clearest answer we have to a fair question: should anyone own something this fundamental? We think the right answer is that the people who can afford it pay for it, and the people doing the work that matters most don't.
Six ceilings the industry designs around. One we keep.
The one we keep
Amdahl's law. Speedups do not add. Our parts summed claim 116.64% off the bill; the composed measurement delivers 84.54%, and that is the number we publish. Saying so is worth more than the 32.1 points it costs.
Your workload. Your comparison.
The only honest way to sell this is to stop talking.
It runs in shadow on your own traffic. Same machines, same models, same answers going to your users.
Your traffic. Your bill. Your numbers, not ours.
All of it, some of it, none of it — the comparison is yours either way.
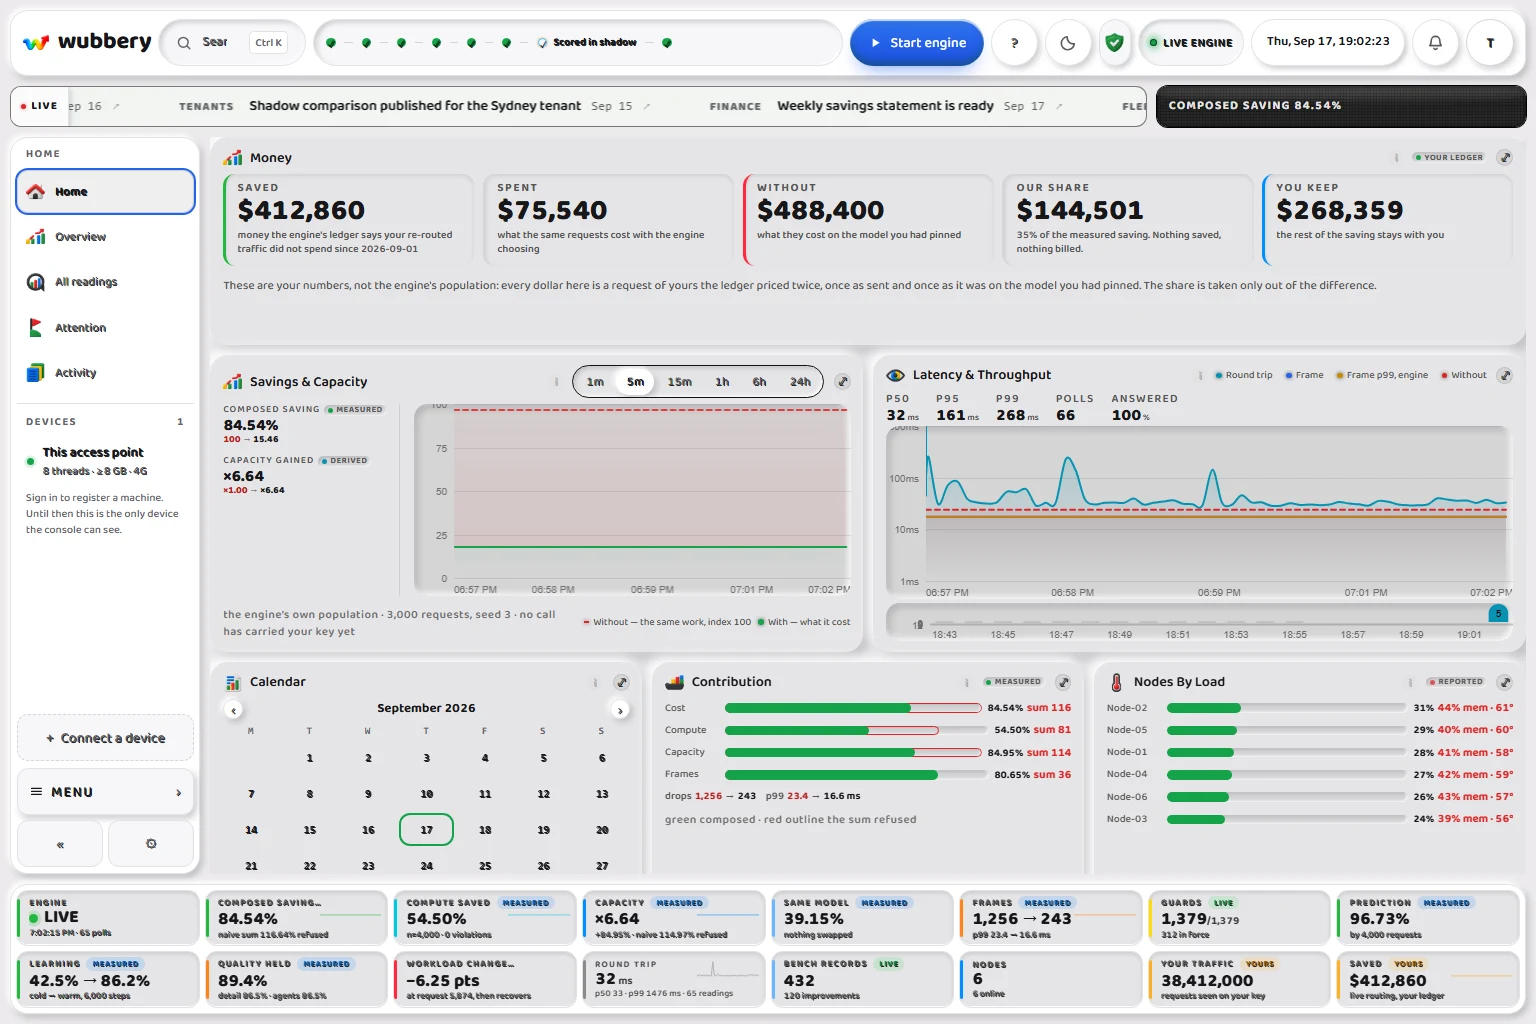
It touches nothing, and you can stop it in a click.
We run on your traffic before you have paid us a cent. A company paid by consumption has no reason to offer that, because its number goes down when yours does.
Pricing — aligned from the start
35% of what we save you. Or 25% of the whole gain.
Take the cost modules alone and it's 35% of the saving.
Take the performance modules too and it's 25% of everything you gain — savings plus the capacity you get back.
Say you spend $100.00 today. With the cost modules alone we save you $84.54 of it. Our share is 35% of that saving, $29.59, so your total is $45.05 instead of $100.00, and $54.95 of the saving stays with you.
Take the performance modules too and the same $100.00 also buys $119.78 of extra capacity, valued at your own rate. That is $204.32 of value in all; our share is 25% of it, $51.08. The lower rate on the wider base: you pay the smaller percentage, we earn the larger amount, and nobody has to lose. On a $10.00M spend the same arithmetic is $2.96M or $5.11M.
Small usage is free. Not a trial. Not a tier that expires. If we haven't saved you enough to be worth invoicing, there's no invoice.
Large accounts negotiate a floor, credited against the share, never added to it. You pay the greater of the two, never the sum.
Every comparable company earns more when you spend more. We earn out of the reduction.
That's not positioning. It's arithmetic — and it's why we can hand you a free run on your own traffic and a public endpoint that answers anyone, while they hand you a case study.
The foundation
“The innovator has for enemies all those who have done well under the old conditions.”— Machiavelli, The Prince

Every major shift in technology means overcoming what Machiavelli called the enemies of the old conditions — those who profit from legacy inefficiency. Today's AI infrastructure market is built on structural waste, with enormous capital flowing into hardware to solve problems that were never hardware problems. Wubbery is the introduction of a new order.
Guided by the Steve Jobs philosophy that the foundation of our technology stack is ours to reinvent, we went back and rebuilt it.
While the rest of the industry plays the intelligent fool — scaling up hardware complexity and calling it progress — Wubbery moves in the opposite direction, through elegant mathematical optimisation. The result is constant at every step no matter how much you are holding: a thousand things or four million, the same wait. Your savings appear live in your own console. And we operate on a purely performance-aligned model — a 25% share of the combined savings and improvements we generate.
We don't ask investors or CFOs to trust a pitch deck. We start a shadow run on your live traffic and prove 1.856–1.926 µs per request out of the gate.
Wubbery is rewriting the macroeconomics of compute — proving that true deep-tech genius is radical refinement, not hardware inflation.
TIMOTHY HARKIN · Founder, Wubbery
The processor
Everything on this page runs in software today, on hardware people already own. It was designed for silicon, and the processor now in progress carries the same results at the cost of the electricity to move them.
What a machine can do inside that silicon changes every industry that computes: the bill, the work completed, the time an answer takes, and the power it took to get there. The eight comparisons above are the software version. The processor is the same answers with the hardware built around them, shipping into an installed base already running the architecture.
Every chip company raises on simulation. WUBBERY is raising on a shipped implementation with measured results a stranger can reproduce. What we will not do is describe how it works on a public page: patent protection in Europe and China is lost by publishing before filing, and we would rather own it than explain it.

Running in software, on hardware people already own. Revenue now.
The same answers moved into hardware, where the work costs nothing at all.
A processor built for it, shipping into an installed base already running the architecture.
curl https://api.wubbery.com/v1/public/proofAny terminal on Mac, Windows or Linux runs that as written. On a phone, open it in your browser — the same figures come back as a page.
No key. No signup. No sales call. It answers anyone who asks, and it returns the headline figures you just read — the bill, the compute, the capacity, the frames, the refusals and the learning curve. The rest are measured on named machines, and we say which is which.